The UN’s Sustainable Development Goals are claimed to constitute an all-encompassing policy framework, but what happens when targets negate each other?

SDG researchers understood very early (Weitz et al, 2017) that the SDG targets are interconnected, with most targets having implications on the attainability of others. Understanding this web of interactions will undoubtedly support implementation and priority-setting. To this end, a simple but powerful qualitative typology was developed (Nilsson et al, 2016) which allowed researchers to score every interacting pair of targets on a seven-point scale of -3 to +3. An International Council for Science team created a database of hundreds of interactions between the SDG targets using the Nilsson typology, allowing a detailed network analysis of the framework.
The Network
What we usually picture when we think of a network is a messy connect-the-dots drawing of points (aka nodes) joined up by lines (aka edges). This is an abstraction of a system, and just about any system can be represented as a network, because a system is simply a set of components that are connected in a particular way (Donella Meadows literally wrote the book on understanding systems and I cannot recommend it enough). To abstract the SDG framework as a network all we had to do was make a list of the targets (as nodes) and all their known interactions (as edges), and assign edge weights as suggested by the ISC’s research. This was a straightforward job using the powerful igraph package in R. You can see the resultant network in the widget below, and explore its structure by clicking and dragging nodes.
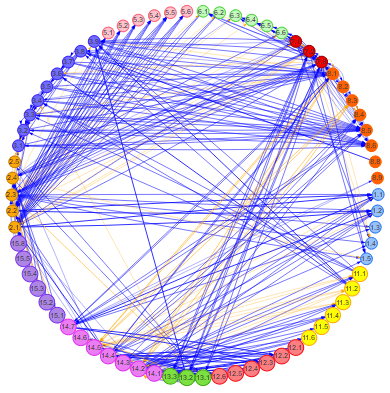
Each node in this network represents an SDG target, and each node colour is a different Goal. Each edge represents a positive (blue) or negative (orange) interaction, and the magnitude of the interaction on the Nilsson scale is represented by edge width. The first thing we notice is that there are many more positive interactions than negative ones; a good sign for policymakers, implying progress on most targets will naturally lead to progress on others. The second thing is that it’s a mess. Sure, it’s easy to quickly see that implementing e.g. SDG target 2.1 will have over a dozen mostly positive effects on other targets, but this is just a first-degree impact. Looking at the network for a few moments brings up a host of other questions:
- How will the targets affected by achieving e.g. 2.1 impact their downstream targets at second- and third-degree, and beyond?
- How far will a substantial policy achievement in one node reverberate throughout this impact network, and how powerfully?
- Are there nodes with an overall positive or negative influence on the network?
- Are there driver nodes, that is, nodes which allow you to control the entire network?
- Are there discrete communities, that is, sets of nodes that interact with each other more frequently than with other nodes?
- Are there manipulable feedback loops and other leverage points?
Questions around how impacts ripple through a network are not easily answered without some sophisticated network analysis and programming. Think of the network like a switchboard where each switch can toggle on and off, but doing so changes the on/off state of any number of other switches. Depending on its size, there are hundreds or even thousands of potential on/off arrangements (aka system states) the board could be in. We used something called cross-impact balance (CIB) analysis. It’s a mouthful, but essentially there’s a clever bit of software that lets you explore how changes in an impact network will move through it until the entire system reaches a point of stability. More on that later.
Our problem is a bit more complicated than the switchboard analogy: we have a network with 70 nodes and over 300 separate edges where each edge may be weighted six different ways (seven if you count 0 as a weight, which you shouldn’t). The number of possible combinations is astronomical, and the CIB software (and my CPU) wasn’t going to be enough to deal with it. We had to trim down the network.
Community Detection
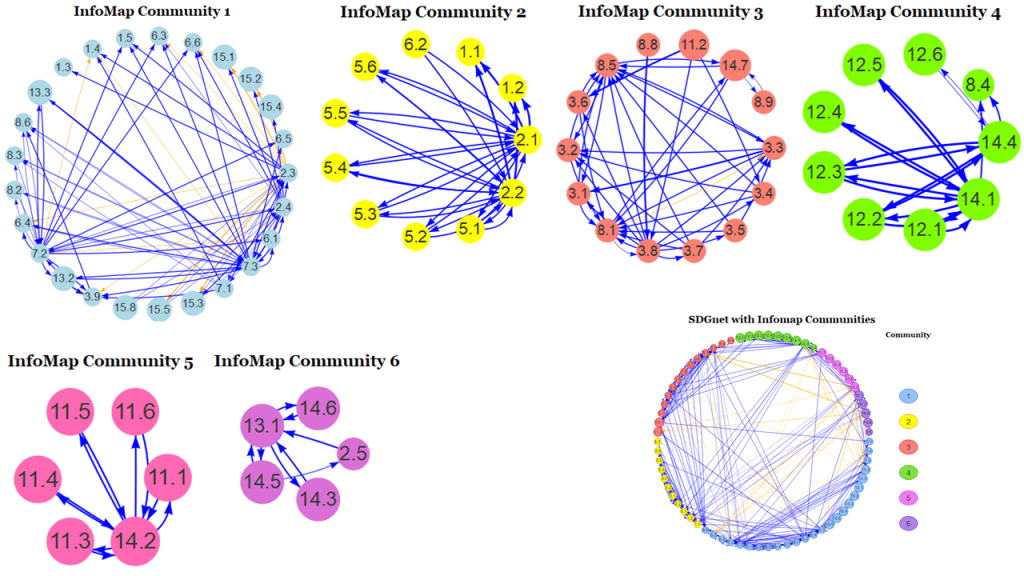
The need to trim down the network was also an opportunity to explore an interesting question, “Are there discrete communities?”. This isn’t just interesting from a network theoretical perspective. From a policymaker’s point of view, knowing that a specific set of targets influence each other more than they do others is an essential piece of information; you can build interdisciplinary/cross-departmental working groups on that basis, or even rearrange the entire structure of government departments if you’re really ambitious. There are many ways to break down a network into communities and, without boring you with the why of it, we settled on the InfoMap algorithm (Rosvall et al, 2009). This gave us six distinct clusters on which we could carry out a CIB analysis.
Driver Nodes
From a policy-making perspective, understanding the driver nodes would be a serious force multiplier. These would be targets that give disproportionate control over the network. For example, we found that target 7.2 (increase the share of renewables in the energy market) was a potential driver node, which makes sense: increasing the supply of energy would support industrial and economic growth targets, and restricting that supply to clean energy sources would support environmental sustainability targets.
Strictly speaking, the best way to identify driver nodes would be to use the mathematical graph matching approach, which was demonstrated effectively in controlling worm movement through their nervous system. This approach works great in homogeneous networks like the nervous system, where the interactions are all of the same quality, but its use is questionable in a heterogeneous network such as ours. This is because our network is composed of asymmetric and qualitatively different interactions. Taking again target 7.2 as an example: among other things, increasing renewable energy will have a positive impact on reducing carbon emissions (targets 13.1-3) by phasing out fossil fuels from the power grid, and on building the resilience of poor communities to extreme climatic events (target 1.5), presumably due to a potential drop in extreme events if decarbonisation happens quickly and because the decentralised nature of some renewables would give energy security where grid infrastructure is lacking. Clearly, however, the ways in which these impacts will occur are qualitatively and quantitatively different. The network is full of such asymmetry and qualitative difference, meaning the full mathematical treatment required by graph matching is not possible. Instead, we opted for a more heuristic approach based on centrality measures.
Centrality is a measure of the most important nodes in a network, and there are different ways of measuring a node’s centrality. We used these: betweenness counts the number of shortest paths passing through each node; eigencentrality measures how many highly-connected nodes connect to each node; closeness is the sum of the lengths of the shortest paths between each node and all other nodes. Calculating these scores for every node, we identified the most influential nodes in every community and set about testing them in the CIB analysis software.
Cross-Impact Balance Analysis
Jumping back to the switchboard analogy, where there are any number of possible on/off combinations (aka states) for the system, a CIB analysis can determine both the possible states and the most plausible ones. Put simply, CIB asks, “How will a change in target a cause a change in target b?”, and iterates this pairwise questioning across the network. It thus follows all the different causal chains around the network until they come to rest. All the researcher has to do is know what the pairwise interactions are (or which switch toggles which, in our analogy). That’s pretty cool.
Carrying out a run of CIB analyses on each community told us how many unique, plausible states there are for each community. By “plausible”, we mean a combination of the possible status (progress/no change/regress) of every target that takes into account how that status would affect connected targets. Put in terms of the switchboard analogy, a “plausible” state is one where the on/off combination of switches is entirely consistent with what we know about how those switches affect each other. A community with a high number of plausible states is not great news for those interested in policy implementation because it means there are many ways in which a policy’s effects can play out, making prediction and control of the results difficult. We found that only two of the six communities had a large number of plausible states: community 1 with 264, and community 4 with 57 (corrected to account for difference in the size of these communities). That the largest community by far has the greatest number of plausible states is no surprise. This community also contained the greatest number of driver node candidates and the broadest spread of Goals, so it was an ideal place to test out the influence of our driver node candidates on the network. Those candidates are:
- Target 2.3: By 2030, double the agricultural productivity and incomes of small-scale food producers, in particular women, indigenous peoples, family farmers, pastoralists and fishers, including through secure and equal access to land, other productive resources and inputs, knowledge, financial services, markets and opportunities for value addition and non-farm employment
- Target 7.2: By 2030, increase substantially the share of renewable energy in the global energy mix
- Target 7.3: By 2030, double the global rate of improvement in energy efficiency
We simulated the effects of successful policy implementation by “locking in” a driver node, forcing the network to assume progress on that target and rearrange itself around it. We found that:
Doubling agricultural productivity (target 2.3) impeded any progress on target 15.5 (reduce the degradation of natural habitats) while having positive outcomes for target 1.3 (implement social protection systems and by 2030 achieve substantial coverage of the poor and the vulnerable). Progress on this target had no other effects on the community, so not that much of a driver node after all. It is interesting to consider, though, how agricultural productivity must be defined in the scientific literature if doubling it invariably causes degradation of natural environments. Another dynamic going on here is a positive feedback loop between target 2.3 and several others (2.4, 6.1, 7.2, 7.3) which amplify 2.3. As this target is the only impact source for 15.5, the more 2.3 gets amplified then the more the environment is degraded.

Increasing the share of renewable energy (target 7.2) and doubling the rate of improvement in energy efficiency (target 7.3) each had positive effects on pretty much all other targets in the community. Since energy is the backbone of modern society, and many of the forms it comes in have severe negative impacts (i.e. fossil fuel burning, coal mining, and even biofuel production), it is unsurprising that gains in renewable sources or energy efficiency would support many other economic and environmental targets. The only notable exception in this case was, again, target 15.5.
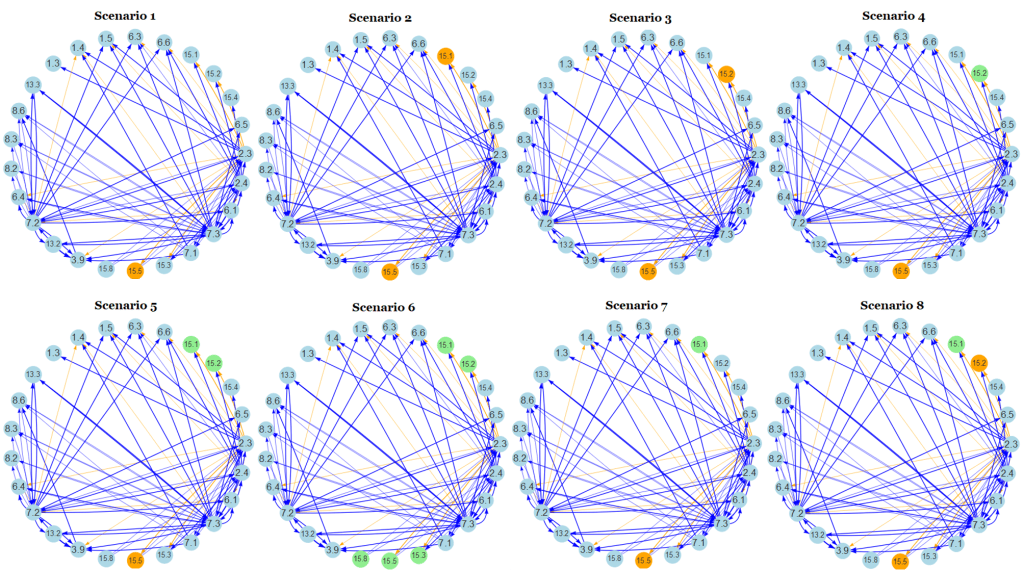
I should note that “locking in” the assumption of progress is a two-way street because, as well as showing the effects on other targets, it also highlights which targets must themselves take on a particular state in order to allow the “locked-in” target to progress. Even with this caveat, targets 7.2 and 7.3 are still convincing driver node candidates because of their high eigencentrality scores (connectedness to highly-connected nodes) and large proportion of outgoing edges.
Conclusion
There is a lot more I could write about the interplay of targets in community 1, and I haven’t even begun to explore the smaller communities I identified above. The purpose of this project was to provide a proof-of-concept for identifying priorities, leverage points, and pitfalls for people working on SDG implementation. By identifying and “locking in” potential driver node targets in a CIB analysis, we can see its impacts on the network and identify feedback loops and other dynamics that could be exploited or avoided by policymakers.
It’s important to note that a major drawback of this approach is the data used to build the network in the first place. Economists, social scientists, environmental scientists, biologists, and all sorts of other experts took part in a massive literature review to score interactions between every pair of SDG targets, making judgement calls on how to score complex dynamics on a simple scale of -3 to +3. The network model is only as accurate as the data it is built on. Even more fundamentally, some have argued that the SDG framework itself contains contradictory assumptions and represents a compromise between competing ideologies. For example, the “strong sustainability” school of thought argues that exploitation of natural resources must be drastically reduced to protect the environment (which has negative implications for GDP economic growth targets), whereas proponents of weak sustainability champion the idea of full substitutability between natural and human resources (i.e. human innovation can protect the environment without the need to reduce overall consumption). This could throw out contradictions in the network, which a CIB analysis will interpret as inconsistencies, but it will be extremely difficult to tell whether the inconsistency stems from an “organic” contradiction (such as between doubling agricultural output and preserving the natural environment, as I explored above) or from an ideological disagreement glossed over during the authoring stage of Agenda 2030.
