I recently had the chance to work with an unfamiliar dataset, the Annual Survey of Hours and Earnings (ASHE). This yearly survey of about 50,000 businesses is a treasure trove of disaggregated data for those interested in population earnings breakdowns in the UK.
There’s a lot to explore, but I’ll stick with something straightforward: the gender pay gap. Disappointingly (but sadly unsurprisingly) it still exists, and it’s not insubstantial. Check out the difference in the median weekly earnings of full-time workers in 2019:
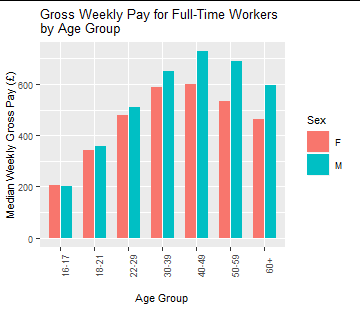
What’s starkest is how quickly the gap widens as men and women enter middle age. Between the age of 30 to 49, men’s weekly salaries rise by about £70 while women’s rise by less than £10. Both genders see their wage decrease at 50, but at somewhat different rates, and men will reach retirement with substantially higher wages. The data for 16-17 year old workers includes those paid under-18 wages, so it’s not as useful (and also the sample for that age group is much smaller, therefore less accurate, than for other age groups).
This is all well and good for those of us who are in full-time work. But according to recent research from Resolution Foundation, two-thirds of the growth in employment since 2008 has been in ‘atypical’ roles such as self-employment, zero-hours contracts or agency work. So for the increasing number of people who work this way (which at times includes myself), what does the pay gap look like?
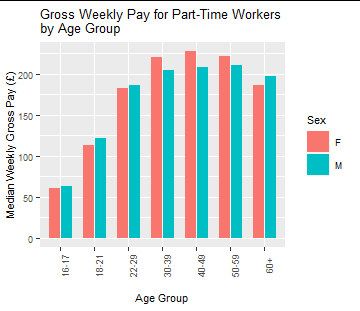
Surprisingly different. Men tend to earn more at first, but then women catch up and overtake them, making around £25-£45 more over the course of their 30s to 50s. It’s difficult to say exactly what is going on here without a qualitative investigation (e.g. of the reasons for part-time working), especially as “part-time” in this case can mean anything from four to 32 hours a week. It’s tempting to speculate that women in their 20s are more likely to give birth in that decade, entering their 30s as their children starts full-time school, giving more hours of the day for part-time working. However, seeing as the average age of a British woman the first time she gives birth has been rising steadily and is now at about 30, this explanation doesn’t fit. An alternate explanation could be more simply that women who work part-time tend to work more hours than men working part-time.

This figure shows the wage gap between men and women in full-time and part-time employment. Everything right of the y-axis is how much more men earn than women, everything to the left of it is women earning more than men. So we can see that even though women working part-time can expect to earn a little more than their male colleagues, the real star of the show here is the full-time gender pay gap. From their 40th year onwards, men working full-time can expect to be earning over £100 a week more than women.
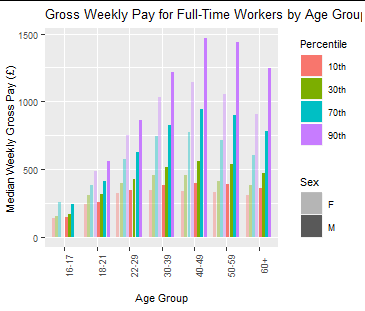
We can break it down even further though. All the above data is based on the medians for each entire age group, but the ASHE dataset is also broken down into percentiles. There’s a lot of information in this next figure, so let’s take it step by step:
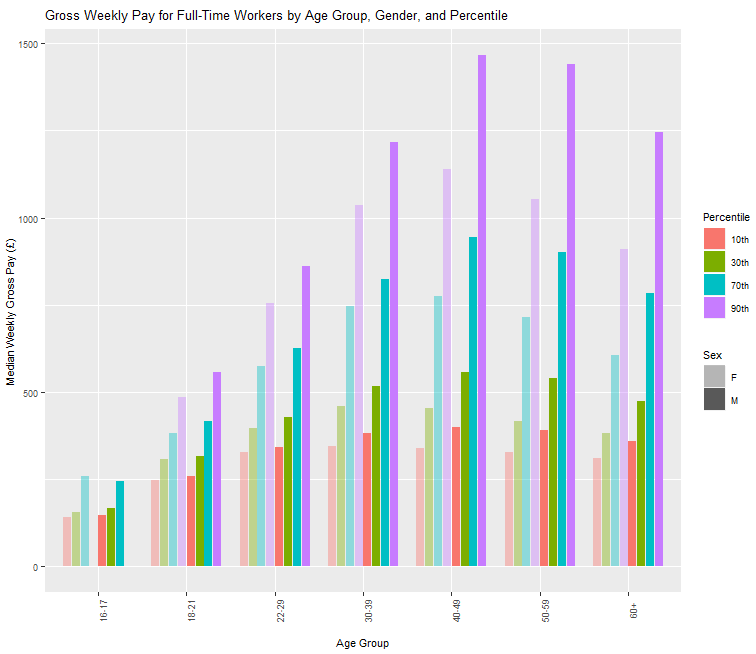
We have median weekly wage on the y-axis and age groups on the x. Then we have four colours, each of which corresponds to a different percentile. Finally, the columns are grouped by sex, which is indicated by transparency: opaque columns are male, transparent are female. (The 16-17 age group has missing data for the 90th percentile, hence fewer columns).
So now we can compare not just the gender wage gap, but income inequality too. The 10th percentile is the value below which 10% of weekly wages fall, that is, the lowest earners. The 90th percentile, conversely, is the value below which 90% of weekly wages fall, so the top 10% of earners fall above that value. The first thing to notice is that the gender gap exists in every age group and percentile, and that the older the age group the more pronounced it becomes.
Another interesting trend, especially from the point of view of intersectionality and equalities, is that the greater the percentile, the wider the gender pay gap becomes. E.g. men in their 40s who are in the top 10% of earners take home around £300 more per week than women in the same conditions, whereas for the 70th percentile it’s more like a £200 difference, and at the 30th percentile it’s less than £100.
Finally, the difference between the 10th and 30th percentiles is not that big, especially when compared with the difference between the 90th and 70th percentiles. This hints that the underlying data is skewed to high values, which is also borne out by a quick look at the descriptive statistics: the mean weekly wage for all employees in 2019 was £571.2, while the median was £479.1. That is to say, there are some extremely well-paid individuals in that top 10%.
